The first data from Landsat 9, from the Australian coast of Kimberley in Western Australia, shows the capabilities of the two satellites. This image, taken from Operational Land Imager 2, or OLI-2, was obtained on October 31, 2021. Although similar in design to its predecessor Landsat 8, improvements to the Landsat 9 allow it to detect more subtle differences, particularly in darker areas. Like water or dense mangrove forests along the coast.
Landsat 9, a joint mission between NASA and the US Geological Survey, launched on September 27, 2021, and has now collected its first images of Earth.
These images, all taken on October 31, 2021, provide a preview of how the mission is helping people manage vital natural resources and monitor the effects of climate change, as well as Landsat’s unparalleled data record of nearly 50 years of observing Earth from space.
In the photos available on the Landsat 9 website (https://svs.gsfc.nasa.gov/13987) coastal ecosystems in Australia illustrated; intersection of cities and coasts in the Florida Panhandle; The high mountain glaciers of Asia and the agricultural fields surrounding Lake Erie.
The Landsat 9 carries two imaging tools: the Operational Earth Imager 2, or OLI-2, which detects nine different wavelengths of visible, near-infrared, and short-wave infrared; and the Infrared Thermal Sensor 2, or TIRS-2, which detects two wavelengths of thermal radiation to measure subtle differences in temperature. These tools will provide Landsat 9 users with key information on crop health, irrigation use, water quality, fire intensity, deforestation, glacier retreat, urban sprawl, and more. OLI-2 was built by Ball Aerospace and TIRS-2 was built by NASA’s Goddard Space Flight Center. Northrop Grumman built the Landsat 9 spacecraft, combined it with instruments, and tested the observatory.
The NASA Landsat 9 team is working through a 100-day observation period, which includes testing various satellite systems, subsystems and calibration tools in preparation for the mission handover to the USGS in January. The USGS will operate Landsat 9 alongside Landsat 8 and together the two satellites will collect approximately 1,500 images of the Earth’s surface each day, covering the globe every eight days. Landsat 9’s data will be publicly available, free of charge, from the USGS website, once the satellite begins its normal operations.

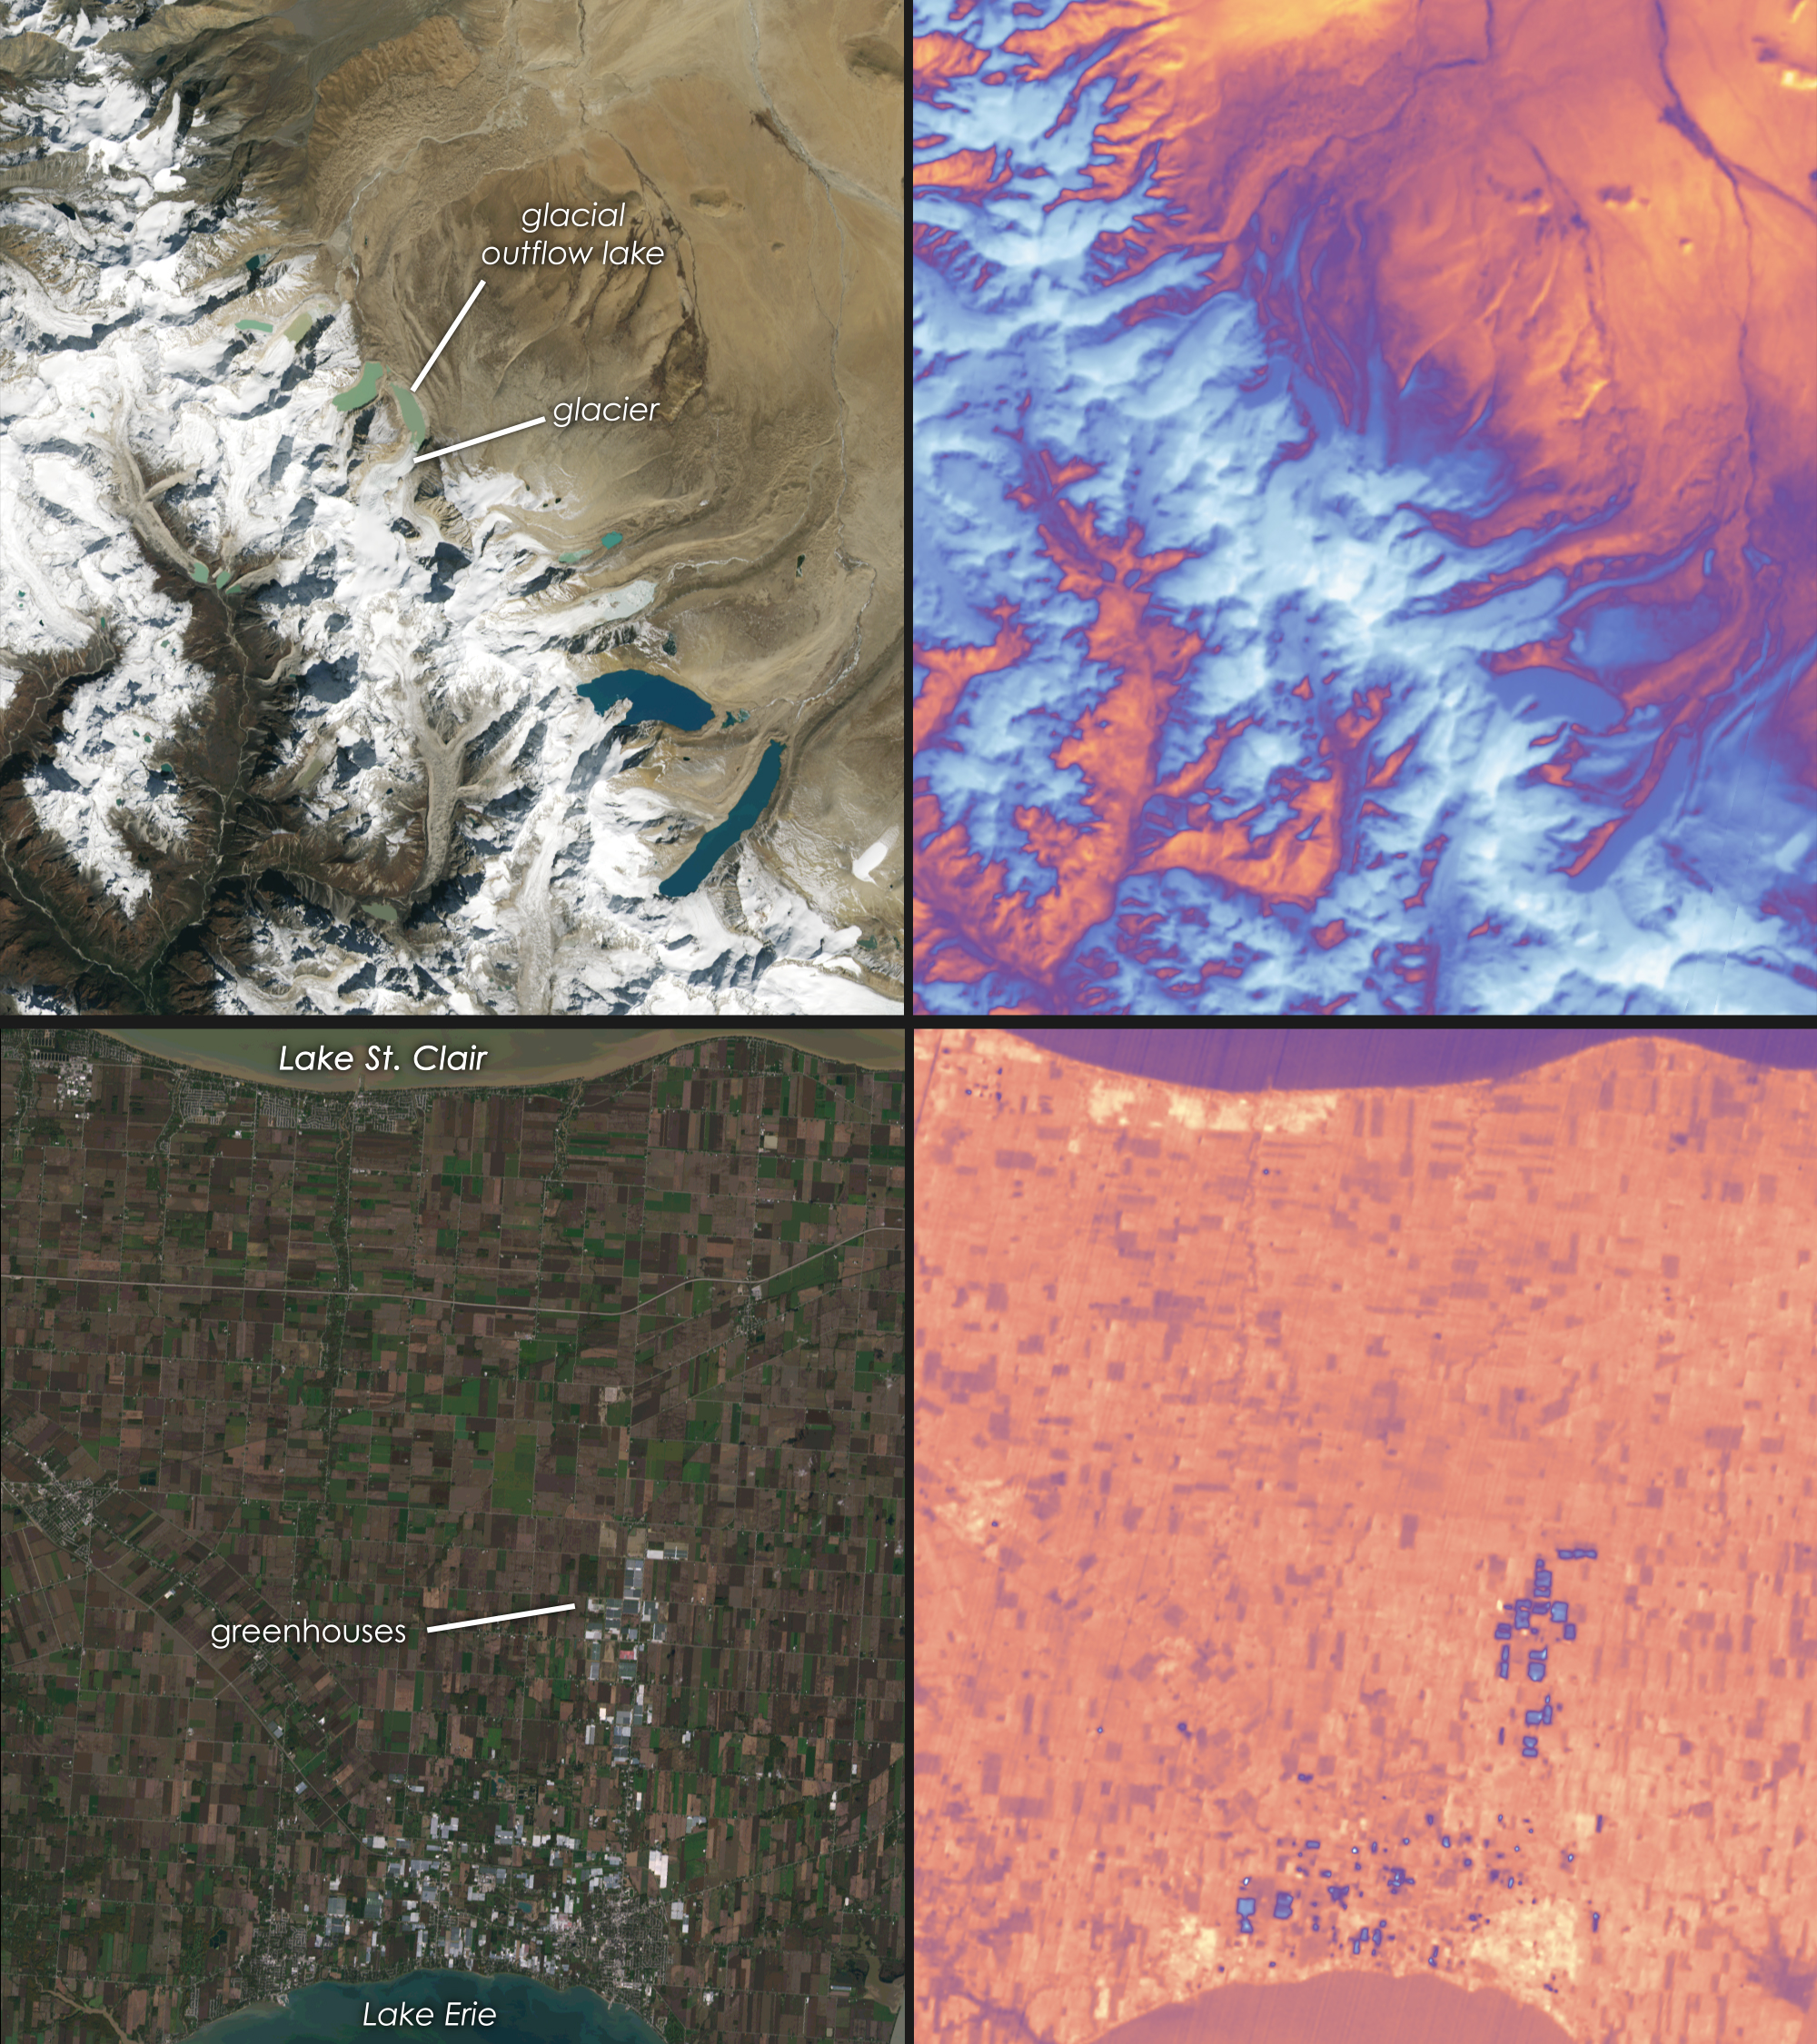
Data from both devices is shown in the pair in this image.
The upper left shows the snow and glaciers of the Himalayas, leading to the flat Tibetan Plateau in the north. The upper right shows the same region in the TIRS-2 thermal data. Blue and white indicate relatively cooler surface temperatures, while orange and red indicate warmer surface temperatures. The lower left corner shows the brown and green rectangles of agricultural fields in southern Ontario, sandwiched between Lake Erie and Lake St. Clair. The white and gray rectangles in the lower part of the image are production greenhouses, which appear as blue (relatively cooler) spots in the TIRS-2 image on the right.
Some quick links to download the first images:
https://svs.gsfc.nasa.gov/vis/a010000/a013900/a013987/L9_Navajo_hyperwall_rgb_labels.jpg
https://svs.gsfc.nasa.gov/vis/a010000/a013900/a013987/L9_Himalaya_hyperwall_rgb_labels.jpg
https://svs.gsfc.nasa.gov/vis/a010000/a013900/a013987/L9_Florida_20211031_p019r039.jpg
https://svs.gsfc.nasa.gov/vis/a010000/a013900/a013987/L9_Australia_20211031_p109r070.jpg
(Fonte: NASA’s Goddard Space Flight Center, using data from USGS)
Copy the “shortlink” to this article here
www.geoforall.it/kyxuw


Leave a Reply