After a year full of bulls, the Wall Street growth room for US stock markets has shrunk, but the end is still a long way off. With this sentence we can summarize what happened in 2021 and the expectations for 2022.
We remember that in the report published at the end of 2020, we pointed to a full-year rally for the Dow Jones and other US indices. In fact, we wrote the following
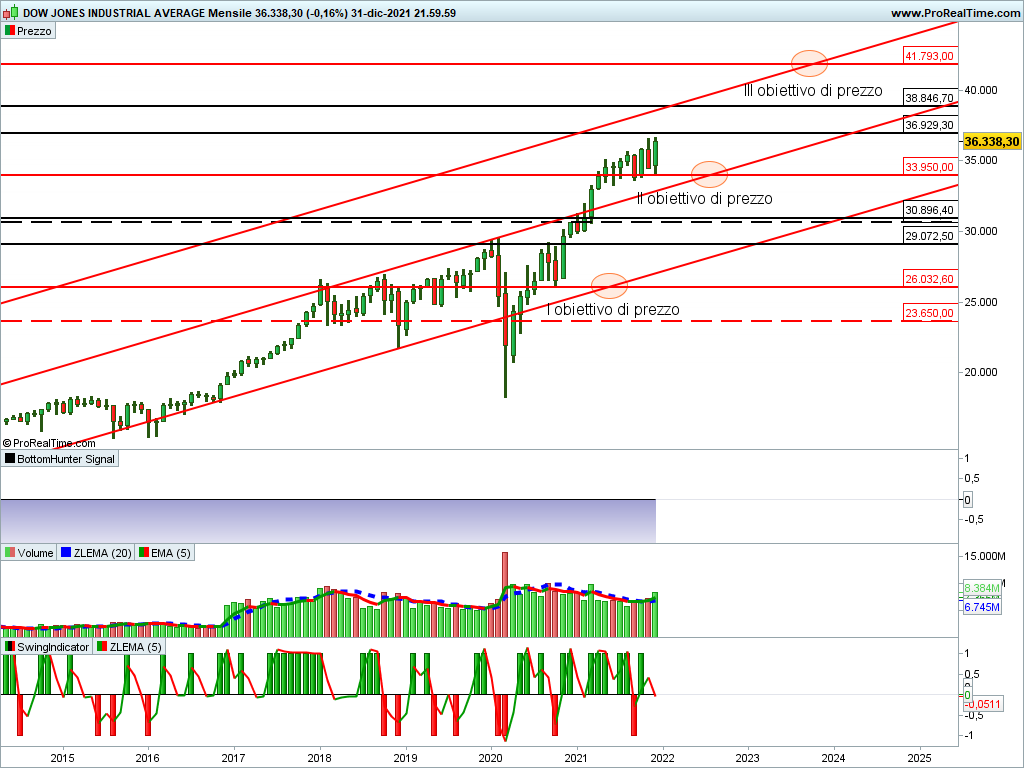
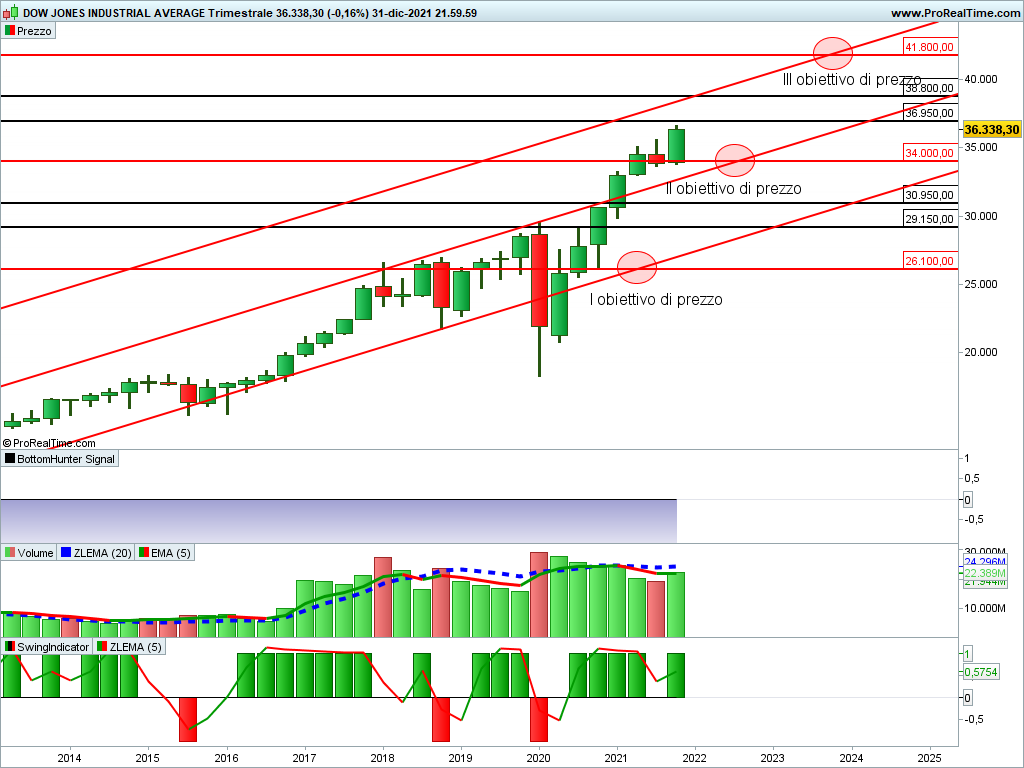
As can be seen from the following charts, there is consistency in the scenarios between the monthly and quarterly time frames. Both, in fact, give a continuation of the ascent for 2021 with a maximum upside potential of 40%. Prices are in fact oriented towards the second price target in the 33,936 area first, then the third price target in the 41,793 area then.
The closing of the fourth quarter of 2020 confirmed the expected trend. While we wait to discuss the details of what will happen in the new year, let’s take a look at the seasonality of the Dow and the expected fractal.
According to the forecast fractals, the beginning of 2022 should be marked by weakness with the formation of a minimum in the first half of the year. After that, the multi-year rise should begin to achieve all-new heights.
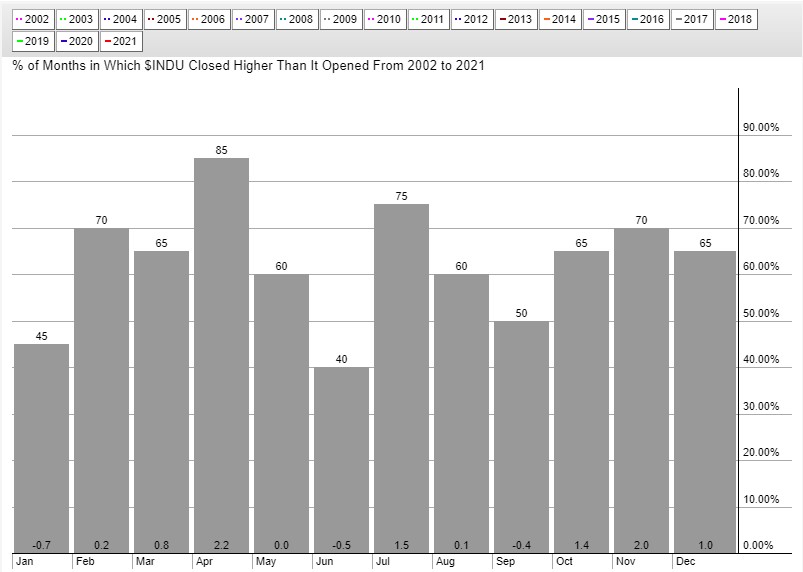
It is also evident that the beginning of the year is marked by weakness from the graph showing the probability, calculated over the past 20 years, that the month will have a higher monthly close than the opening. In fact, January, along with June, represents the lowest probability of closing the month.
After a full year of rally, Wall Street’s growth space for US stock markets shrunk: Indicators of graphical analysis
the Dow Jones (DJ30) closed the session on December 31 at 36338.3, down 0.16% compared to the previous session. The change on a weekly basis was up 1.08%.
The current projection is bullish on both the monthly and quarterly time frames. The important thing to note is that in both time frames, price Target II was not only reached as predicted in the annual report published at the end of 2020, but prices closed above this level.
Therefore, at this point, all that remains is to expect the achievement of the third price target located in the 41800 area.
The bullish scenario will stop in the event of the monthly close, which is confirmed later in the quarter, below 33,950. This level, in fact, stopped prices falling several times in 2021.
mensile time frame
Trimester time frame
(We remind you to read the warnings in this article carefully which can be referenced Who is the”)

“Infuriatingly humble alcohol fanatic. Unapologetic beer practitioner. Analyst.”


